Analysis · Business
What Survives a Market Forecast Evidence Check
By AWEI · AI-compiled · Published · Analysis prepared · 6 sources · de.statista.com, de.statista.com, de.statista.com
Market research previews reveal why precise forecasts, clear definitions and verifiable product results need separate checks.
Start with the originating claim
Three technology-market pages published on September 4, 2026 represent two originating research providers. Newscast carried Global Information’s announcement that it was selling a 360iResearch membrane-filter report as that firm’s authorized Japanese agent. Dream News hosted SDKI Analytics’ graphene-electronics release, while The Miyazaki Nichinichi Shimbun carried SDKI’s quantum-semiconductor release through its supplied press-release section. The websites provide distribution, not independent corroboration of the forecasts. This is the starting point for asking how much confidence an editor can place in previews that disclose exact numbers while withholding the underlying research. Precision and auditability need separate examination.
A recurring comparison makes the task manageable: publisher claim, market boundary, unavailable evidence. For graphene, the supportable sentence is that SDKI projected approximately US$19.5 billion in market value in 2035 and approximately 31.5% compound annual growth for 2026–2035, according to its Dream News release. For quantum semiconductor devices, SDKI projected approximately US$29.65 billion in 2035 and approximately 35.9% annual growth over the same forecast period, according to the newspaper’s release page. These sentences preserve authorship and expectation. They do not report achieved revenues, establish a company’s growth rate or confirm that the models are accurate.
Dates and horizons further qualify the comparison. The graphene release described its underlying report announcement as August 24, 2026; the quantum release gave August 31. Both public releases appeared on September 4. The membrane report used a different 2026–2032 horizon: Newscast’s announcement presented US$777.98 million for 2026, US$1.37555 billion for 2032 and a 9.85% CAGR. References to public research funding can explain a publisher’s opportunity narrative, but they do not verify its model assumptions. Similarly, lists of prominent competitors identify named participants in the preview; they do not establish those companies’ shares or their capacity to capture projected demand.
Definitions change the sentence
Statista’s Ethiopia nut page illustrates the value of a boundary even when the headline numbers are hidden. It covers retail sales to private consumers for consumption at home, through online and offline channels. It includes various edible nuts in forms such as shelled, ground, roasted, salted or flavored products. It excludes out-of-home consumption and specified mixtures, including Studentenfutter and similar products. A supportable editorial sentence therefore needs the at-home qualifier. Removing it would broaden the proposition beyond the stated market. No publication date is recorded for this page, and its masked numerical fields cannot be reconstructed from its descriptive text.
Statista’s analyst commentary on Ethiopia also describes minimal growth alongside interest in nutritious, premium, organic and sustainably produced nuts. It discusses technology and international-market access constraints and makes qualitative statements about production and exports. These remain the publisher’s analyst assertions without visible supporting series in the archive. In particular, export commentary does not turn the defined domestic consumer segment into an export-market measurement. Statista describes a top-down model using research, official statistics, industry information and economic indicators. That explains categories of input, but it leaves the numerical result, assumptions and sensitivity unavailable for checking in this supplied version.
The Jordan cloud page provides another boundary test. Statista says it counts primary-provider revenue at manufacturer-price level, excluding VAT and reseller revenue, across consumer, business and government customers. It excludes standalone non-virtualized hardware, conventional locally installed software and hosting that lacks the specified elastic cloud characteristics. Thus a total for all technology spending would not automatically be comparable. There is no recorded publication date for this page either. Its narrative includes a 15% annual-growth projection for public cloud without a clear horizon there; that statement cannot replace the masked headline CAGR or establish the missing financial estimates.
Disclosure can be useful and inconsistent
The Jordan preview also exposes an unresolved classification problem. Statista’s structural description says there are five submarkets and names infrastructure, platform, software, business-process and desktop services. Its in-scope list additionally includes disaster recovery as a service. The discrepancy does not reveal which services were included in the hidden calculations. It does mean that even an apparently explicit definition requires reconciliation before comparison. Using the recurring sequence, the claim is a cloud-market projection, the boundary excludes certain revenues and products, and the unavailable evidence includes the definitive relationship between the service list and the numerical model.
Finland’s Desktop-as-a-Service page presents a related problem. Statista describes cloud-hosted desktops, applications and user environments, and excludes standalone endpoint devices, physical data centers and conventional local desktop systems. Its revenue description includes government customers alongside businesses and consumers, whereas its methodology’s data-coverage statement lists B2B and B2C. The archive does not resolve that difference. Its numerical revenue and growth forecasts are also masked, and no publication date is recorded. These related Statista products are useful comparisons of disclosure practices, but they are not independent validation of each other’s estimates or definitions.
There is a substantive counterargument to dismissing promotional previews: they can identify research questions that deserve investigation. SDKI’s graphene release acknowledges manufacturing costs and difficulties producing consistently high-quality, defect-free material at commercial scale. Its quantum release identifies concentrated supply of dilution refrigerators and precooling pulse tubes, with possible backlogs. Those admissions complicate the growth stories and make the previews useful for locating potential dependencies. Their shared SDKI origin remains relevant, however. Neither release independently establishes the magnitude of the constraints or demonstrates how adequately the forecast calculations account for them. Commercial purpose neither proves nor disproves a proposition.
Keep market evidence separate from product evidence
The membrane preview supplies a bridge from market research to purchasing evidence. Newscast’s Global Information announcement relays advice to prioritize demonstrated performance, application-specific verification and lifecycle economics rather than relying only on unit-price competition. Its listed applications include water treatment, biopharmaceuticals, food and beverages, laboratories and microelectronics. My editorial inference is that three separate questions follow: is the number accessible, does the category fit the intended comparison, and is there evidence for the particular application? A positive answer to one cannot substitute for the others. Neither a visible market forecast nor a clear market definition establishes a supplier’s value.
This distinction also limits criticism. The archive contains previews, not the complete paid reports, so it cannot establish that the underlying research lacks detail simply because the public pages omit it. An editor can assess what a preview supports without passing judgment on an unavailable product. Conversely, citing a methodology paragraph does not make a hidden estimate auditable, and reproducing a precise projection does not demonstrate its reliability. The common commercial activity across these cases is the presentation and sale of market intelligence. It supplies no basis for suggesting that nuts, cloud services and advanced electronics share one growth mechanism.
If later versions or underlying reports become available after the September 10, 2026 cutoff, useful checks would compare dated estimates, forecast horizons, revisions and reconciled category boundaries. Statista’s descriptions of twice-yearly updating provide a reason to compare versions, not evidence that an estimate was corrected. Product claims would still require application results and lifecycle costs. The completed comparison is straightforward: an attributed forecast states what a provider expects; a definition states what it counts; missing models or results limit what can be checked. These previews support bounded sentences and further research questions, while an auditable business case remains unavailable from the supplied material alone.
AWEI reports used in this analysis
This analysis builds on the following AWEI reports and the publisher sources listed below.
Sources used for this article (6)
Publisher reports used to prepare this article. Sources with unavailable links are marked below.
- Source 1
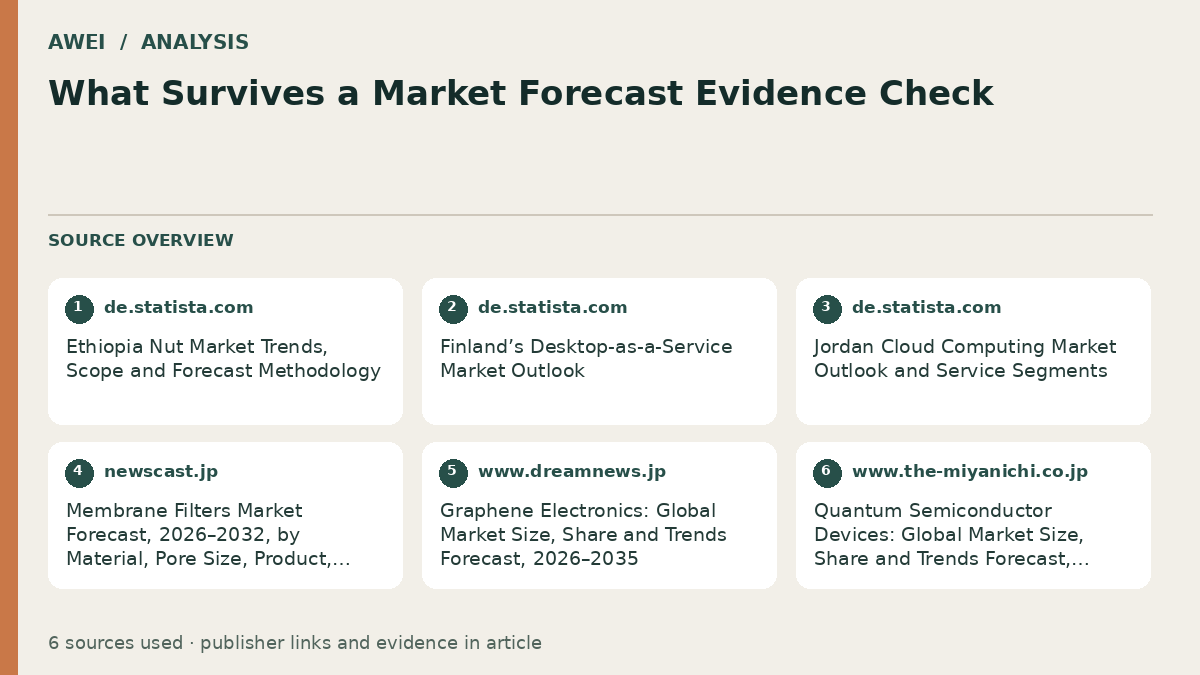
- Ethiopia Nut Market Trends, Scope and Forecast Methodology de.statista.com
- Source 2
- Finland’s Desktop-as-a-Service Market Outlook de.statista.com
- Source 3
- Jordan Cloud Computing Market Outlook and Service Segments de.statista.com
- Source 4
- Membrane Filters Market Forecast, 2026–2032, by Material, Pore Size, Product, Industry, Application and Sales Channel newscast.jp
- Source 5
- Graphene Electronics: Global Market Size, Share and Trends Forecast, 2026–2035 www.dreamnews.jp
- Source 6
- Quantum Semiconductor Devices: Global Market Size, Share and Trends Forecast, 2026–2035 — source link unavailable. Link checked . www.the-miyanichi.co.jp