Analysis · Business
When Market Numbers Become Company Claims
By AWEI · AI-compiled · Published · Analysis prepared · 6 sources · de.statista.com, ijiwei.com, newscast.jp
Market estimates, hidden forecasts and sector averages require different checks before they can support a claim about a company.
Precision leaves the subject unresolved
A net interest margin of 2.01% looks precise, but whose margin is it? Ad-hoc-news.de used RAM's second-quarter 2026 Malaysian banking analysis in an article about RHB Bank, reporting that sector margin fell three basis points while average pretax return on assets increased from 1.33% to 1.39%. The publisher then drew favorable conclusions about RHB's ability to offset pressure. The missing link is a matching set of bank-level results. Sector averages describe the studied group; their precision does not establish that RHB experienced the same movement or achieved the same balance between interest income, other revenue and costs.
The article's capital comparison operates on another clock. Ad-hoc-news.de reported average CET1 capital across eight banks falling from 14.7% at the end of June 2025 to 13.9% at the end of June 2026. It associated the decline with lending growth, securities valuation effects and dividends, while describing the remaining capital position positively. This annual comparison cannot be treated as the same interval as the quarterly margin and return changes. Nor do its sector figures establish RHB's own regulatory position. The stored account includes neither equivalent bank-level ratios nor a concrete share price supporting a valuation assessment.
The research question for this archival audit, bounded by September 11, 2026, is what prevents market intelligence from becoming an unsupported company-performance claim. The answer begins with classifying each statement: reported historical observation, modeled estimate, forecast, attributed explanation or recommendation. The thesis is that different gaps require different checks. A banking average lacks the individual-company link; a market projection lacks an observed future outcome; a masked forecast lacks visible numbers and dates. This is a comparison of how commercial claims are constructed, with no proposed causal connection among Malaysian banks, Ethiopian food consumption and advanced electronics.
An estimate year is not a completed year
The membrane-filter announcement on Newscast makes its time categories unusually explicit. Published on September 4, 2026, it presents a 360iResearch report sold by Global Information, identifying US$712.22 million for the 2025 base year, US$777.98 million for the 2026 estimate year and US$1.37555 billion for the 2032 forecast year. The announced compound annual growth rate is 9.85%. The 2026 value must therefore remain an estimate, rather than completed annual sales. Even the base-year value is a research estimate in this archive, not an independently supplied audited tally of transactions across the market.
The release's recommendation is distinct from its numerical forecast. Newscast's supplied announcement describes applications spanning water treatment, biopharmaceuticals, food, laboratories and microelectronics, and recommends verified performance, application-specific validation and lifecycle economics. That is commercially relevant guidance about what a buyer might need to examine. It does not establish that any supplier has passed the appropriate tests or will capture the projected spending. The interpretation is that market opportunity and product suitability occupy different stages of a purchasing argument. An expanding modeled category could contain products unsuitable for a particular process, while a qualified product could still face an unresolved commercial case.
The SDKI Analytics releases extend the forecasting horizon to 2035. Dream News carried the graphene release on September 4, describing a study issued August 24; The Miyazaki Nichinichi Shimbun carried the quantum release that day, describing a study issued August 31. SDKI estimated graphene electronics at US$1.28 billion in 2025 and projected US$19.5 billion in 2035, with approximately 31.5% annual growth for 2026–2035. Its quantum figures were US$1.38 billion and US$29.65 billion, with approximately 35.9% growth. These are separate market projections from one originating provider, not two outlets independently validating its forecasting reliability.
Market boundaries determine what can be compared
Statista's undated Ethiopia page presents a different obstacle: its headline revenue values, growth rates and forecast years are masked. The visible definition covers at-home B2C purchases of edible nuts, including multiple processing and seasoning formats, while excluding nut mixtures and out-of-home consumption. These boundaries matter before any outside figure could be compared with it. Its analyst narrative also describes minimal growth, qualifying the more expansive language elsewhere about health awareness, plant-based diets and premium demand. Minimal growth remains Statista's qualitative characterization; the hidden values cannot be reconstructed from that phrase or from the positive demand drivers surrounding it.
Statista explains a top-down estimation approach using research, official and industry sources, GDP, consumer spending and price indicators, with twice-yearly updates. That methodological account is useful, but does not expose the resulting values, assumptions or forecast accuracy. Statements elsewhere on the page about increased production and exports lack supporting measurements in the stored text and also concern activities beyond the defined domestic consumption total. Repeated definitions on the same page add no evidence. A reader can identify the modeled basket and inputs without being able to calculate commercial scale, export performance or the expected revenue of a particular nut producer.
A fair counterargument is that models and sector context can support preliminary planning without proving company outcomes. A defined category helps formulate a research question; the membrane announcement's application guidance identifies relevant purchasing considerations; banking averages describe a competitive environment. Missing company proof does not show that the models are false. Source provenance still matters: Global Information is selling 360iResearch's report, SDKI supplies both technology releases, and Statista presents its own estimates. The quantum release's newspaper host explicitly declines to guarantee supplied content. The RHB article relays RAM without including its underlying study. Publication count cannot replace examination of those originating claims.
Operational evidence can narrow the gap
The archived September 5 MLCC report preview on ijiwei.com adds a more operational statement: high-capacitance multilayer ceramic capacitor lead times reportedly increased from 8–12 weeks to 26–40 weeks. The page promotes a JW Insights report and incorporates other organizations' forecasts. Its delivery-time claim could be relevant to procurement because it concerns access to components, but the archive contains no underlying order records, detailed specification coverage or supplier letters. It therefore remains a reported observation whose measurement basis is unavailable. It cannot establish a universal delivery schedule, a particular customer's delay or the resulting effect on any supplier's recognized revenue.
The distinction from the quantum release is consequential. SDKI's account, carried by The Miyazaki Nichinichi Shimbun, identifies concentrated supply of dilution refrigerators and precooling pulse tubes as a possible source of backlogs. It describes a potential constraint, while the MLCC preview reports lead times already lengthening. Dream News's graphene release separately identifies high manufacturing costs and difficulty producing consistently defect-free material at commercial scale. These statements concern different products and evidence statuses. The analytical inference is that quality, qualification and available capacity can limit commercial realization even where growth is forecast; the archive establishes neither a common shortage nor company-level financial consequences from these constraints.
If later disclosures become available, they could connect the opportunity narratives to narrower evidence: application-qualified products, observed delivery times and company financial results. For RHB, that means its own margin, income mix and capital across matched periods before judging whether it shared the reported sector offsets. For component suppliers, it means examining which specifications and customers a delivery claim covers. For Ethiopia's nut market, visible estimates and forecast years remain essential. Future-positive research can retain its legitimate planning role when its status stays explicit. A defined market frames an opportunity; evidence about the named business is needed to assess who captures it.
AWEI reports used in this analysis
This analysis builds on the following AWEI reports and the publisher sources listed below.
Sources used for this article (6)
Publisher reports used to prepare this article. Sources with unavailable links are marked below.
- Source 1
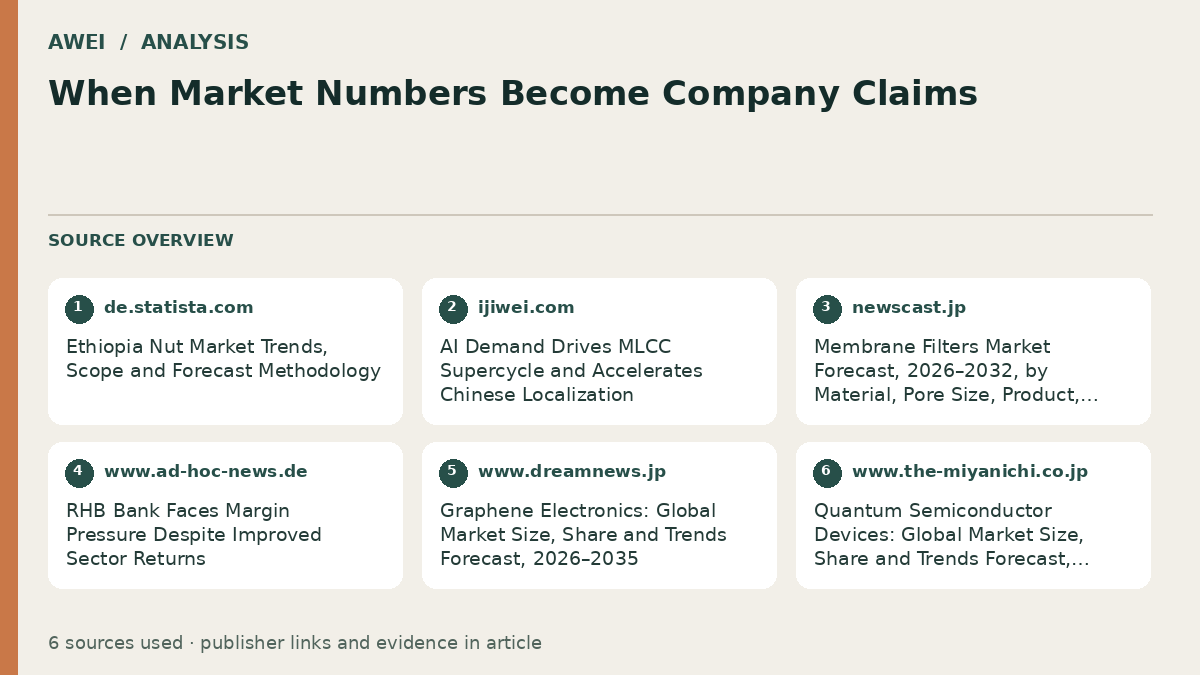
- Ethiopia Nut Market Trends, Scope and Forecast Methodology de.statista.com
- Source 2
- AI Demand Drives MLCC Supercycle and Accelerates Chinese Localization ijiwei.com
- Source 3
- Membrane Filters Market Forecast, 2026–2032, by Material, Pore Size, Product, Industry, Application and Sales Channel newscast.jp
- Source 4
- RHB Bank Faces Margin Pressure Despite Improved Sector Returns www.ad-hoc-news.de
- Source 5
- Graphene Electronics: Global Market Size, Share and Trends Forecast, 2026–2035 www.dreamnews.jp
- Source 6
- Quantum Semiconductor Devices: Global Market Size, Share and Trends Forecast, 2026–2035 — source link unavailable. Link checked . www.the-miyanichi.co.jp